How to Build Ionic 4 Chart.js Apps with Last update: 2019-12-10

When you want to display charts inside your application, there’s a variety of great packages out there that you can use so the question comes up, which one should I use?
In the past we used chart.js with Firebase but the usage is slightly outdated so I thought, looking for a different package makes sense.
However, in the end I came back to ng2-charts and used it so we can create a simple financial stocks tracker that displays real data inside a graph.

Why the turnaround? Let’s start by taking a look at the market options. This is my personal view and I haven’t evaluated all available packages - feel free to leave your experience with other packages below in the comments.
Oh and by the way, we are going to use the awesome free API of financialmodelingprep to get some real data!
Chart Alternatives
A quick search on Google for “angular charts” leaves us with quite a few results, so I checked the packages with the most Github stars which kinda indicates a high usage in the community.
Chartist
If you want to get the smallest, most basic package then you might already stop and drop off here. Chartist looks like the package you can use when you have simple requirements to show data inside a chart, without too many special features.
I would have been my second choice but as said in the beginning, we will use Chart.js in this tutorial. If there’s interest for a Chartist tutorial, just leave a comment below!
ngx-charts
ngx-charts was the first package I gave a try but honestly, I didn’t really enjoy the documentation and examples around it. The Swimlane team (from which we also used the datatables package) did a great job with a slightly unique approach of combiniind d3 and Angular to achieve a better performance for the charts.
However, due to missing examples the task became quite challenging and the result on a real device didn’t provide the experience I was looking for.
If you can spend some time to try out different scenarios and have complex requirements, this package might be your choice in the end.
More great chart packages
Besides these contestors I also found a library using Highcharts and another one using d3.
If you have any previous experiences with these libraries or a reason to choose them, I guess they would make for a great package as well but so far I haven’t taken a deeper look into them.
Setting up our Ionic Chart.js App
So finally we come to the choice of this article which is ng2-charts that’s basically an Angular wrapper around the great Chart.js library.
We can get started with a blank new Ionic app and install the wrapper and the original library:
ionic start devdacticCharts blank --type=angular
cd ./devdacticCharts
npm install ng2-charts chart.js
npm install chartjs-plugin-zoom
You can see we are also installing a zoom plugin - something I really like about Chart.js as you can extend the basic functionality with some really awesome packages.
Furthermore we need to import the httpClientModule since we want to retrieve some data from the API, but of course this is not really related to our charts. But notice that we also import the zoom plugin here. This needs to happen in order to enable it for our charts later!
Now go ahead and change your app/app.module.ts to:
import { NgModule } from '@angular/core';
import { BrowserModule } from '@angular/platform-browser';
import { RouteReuseStrategy } from '@angular/router';

import { IonicModule, IonicRouteStrategy } from '@ionic/angular';
import { SplashScreen } from '@ionic-native/splash-screen/ngx';
import { StatusBar } from '@ionic-native/status-bar/ngx';

import { AppComponent } from './app.component';
import { AppRoutingModule } from './app-routing.module';
import { HttpClientModule } from '@angular/common/http';

import 'chartjs-plugin-zoom';

@NgModule({
  declarations: [AppComponent],
  entryComponents: [],
  imports: [BrowserModule, IonicModule.forRoot(), AppRoutingModule, HttpClientModule],
  providers: [
    StatusBar,
    SplashScreen,
    { provide: RouteReuseStrategy, useClass: IonicRouteStrategy }
  ],
  bootstrap: [AppComponent]
})
export class AppModule {}
In order to use the charts on any page of your app you have to import the module into the according module of the page.
In our case this means we can import it into our home/home.module.ts like:
import { NgModule } from '@angular/core';
import { CommonModule } from '@angular/common';
import { IonicModule } from '@ionic/angular';
import { FormsModule } from '@angular/forms';
import { RouterModule } from '@angular/router';

import { HomePage } from './home.page';
import { ChartsModule } from 'ng2-charts';

@NgModule({
  imports: [
    CommonModule,
    FormsModule,
    IonicModule,
    RouterModule.forChild([
      {
        path: '',
        component: HomePage
      }
    ]),
    ChartsModule
  ],
  declarations: [HomePage]
})
export class HomePageModule {}
Now we are ready to build the real chart functionality in our Ionic app!
Building our Chart View
First of all we need some data, which we can easily grab from the well documented API. The problem you will most likely encounter is bringing your own data into the form that Chart.js expects.
In our case we iterate all the entry points for stock prices and simply push the date into one array and the close value of that day into another. Both arrays (or chartData and chartLabels specific) will be passed to the chart element inside the view, which is actually a bit different from previous versions.
Additionally we can pass options as configuration, the chart type and colors to the element in our view. Again, previously we had to construct one big object but now they are different properties passed to the right element properties inside the view.
Now go ahead with the home/home.page.ts and change it to:
import { Component } from '@angular/core';
import { HttpClient } from '@angular/common/http';
import { AlertController } from '@ionic/angular';
import { ChartDataSets } from 'chart.js';
import { Color, Label } from 'ng2-charts';

@Component({
  selector: 'app-home',
  templateUrl: 'home.page.html',
  styleUrls: ['home.page.scss']
})
export class HomePage {
  // Data
  chartData: ChartDataSets[] = [{ data: [], label: 'Stock price' }];
  chartLabels: Label[];

  // Options
  chartOptions = {
    responsive: true,
    title: {
      display: true,
      text: 'Historic Stock price'
    },
    pan: {
      enabled: true,
      mode: 'xy'
    },
    zoom: {
      enabled: true,
      mode: 'xy'
    }
  };
  chartColors: Color[] = [
    {
      borderColor: '#000000',
      backgroundColor: '#ff00ff'
    }
  ];
  chartType = 'line';
  showLegend = false;

  // For search
  stock = '';

  constructor(private http: HttpClient) {
  }

  getData() {
      this.http.get(`https://financialmodelingprep.com/api/v3/historical-price-full/${this.stock}?from=2018-03-12&to=2019-03-12`).subscribe(res => {
      const history = res['historical'];

      this.chartLabels = [];
      this.chartData[0].data = [];

      for (let entry of history) {
        this.chartLabels.push(entry.date);
        this.chartData[0].data.push(entry['close']);
      }
    });
  }

  typeChanged(e) {
    const on = e.detail.checked;
    this.chartType = on ? 'line' : 'bar';
  }
}
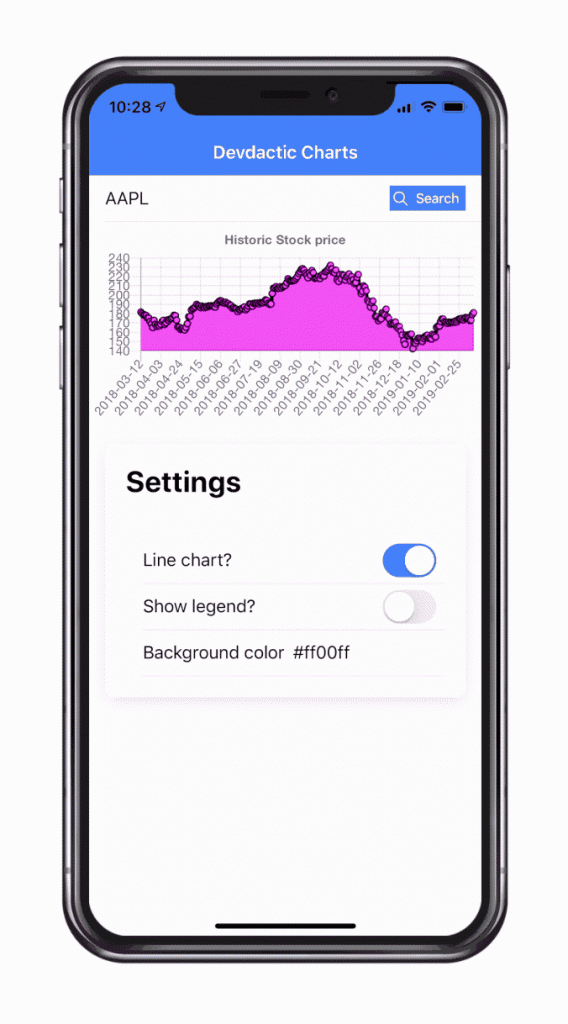
We can change everything dynamically, that’s why I also included a switch so we can toggle a line or a bar chart on and off!
And of course, we can simply search for a stock code like AAPTL for Apple or MSFT for Microsoft.
To do so, we have to implement an input field in our view and a button to trigger our getData() function. Besides that we simply have the chart in our view, which is based on a canvas element and the baseChart directive.
We then pass in all the data we prepared upfront like the data, labels, options and so on. You can also check out all properties here.
Now wrap up the view by changing the home/home.page.html to:
<ion-header>
  <ion-toolbar color="primary">
    <ion-title>
      Devdactic Charts
    </ion-title>
  </ion-toolbar>
</ion-header>

<ion-content>
  <ion-item>
    <ion-input type="text" [(ngModel)]="stock" placeholder="AAPL, MSFT..."></ion-input>
    <ion-button slot="end" expand="full" (click)="getData()" [disabled]="stock == ''">
      <ion-icon slot="start" name="search"></ion-icon>
      Search
    </ion-button>
  </ion-item>

  <canvas baseChart
  [datasets]="chartData"
  [labels]="chartLabels"
  [options]="chartOptions"
  [colors]="chartColors"
  [legend]="showLegend"
  [chartType]="chartType">
  </canvas>

  <ion-card>
    <ion-card-header>
      <ion-card-title>Settings</ion-card-title>
    </ion-card-header>
    <ion-card-content>
      <ion-item>
        <ion-label>Line chart?</ion-label>
        <ion-toggle (ionChange)="typeChanged($event)" checked></ion-toggle>
      </ion-item>
      <ion-item>
        <ion-label>Show legend?</ion-label>
        <ion-toggle [(ngModel)]="showLegend"></ion-toggle>
      </ion-item>
      <ion-item>
        <ion-label>Background color</ion-label>
        <ion-input type="text" [(ngModel)]="chartColors[0].backgroundColor"></ion-input>
      </ion-item>
    </ion-card-content>
  </ion-card>
</ion-content>
At the end of our view we have a card to switch some settings to demonstrate how dynamically everything works together. Nothing fancy, just target the right properties and you are good to go!
Conclusion
Picking a chart library depends on your needs, so if you have very specific requirements it might take you some time to find the perfect fit.
If you are looking for a general robust solution for Ionic, you can’t go wrong with the approach of this tutorial!
You can also find a video version of this tutorial below. https://youtu.be/8sd99RJeYSk
