How to Use Firebase Analytics with Ionic Last update: 2020-08-25

Since you might already use Firebase in your project, why not use the analytics functionality it provides in combination with Google?
Setting up Firebase analytics within your Ionic application is super easy with Capacitor, so we will go throught he whole process today and end up logging some events to Firebase!
We will use the Firebase analytics community plugin, look at the implementation and finally how to debug all of your tracking code. But first, let’s start with Firebase.
Firebase Project Setup
For testing, let’s start a new project within the Firebase console and make sure you have Google Analytics enabled for the new project. The Wizard will connect to your Google Analytics account and you can select one of your accounts and automatically generated a new property in that account.
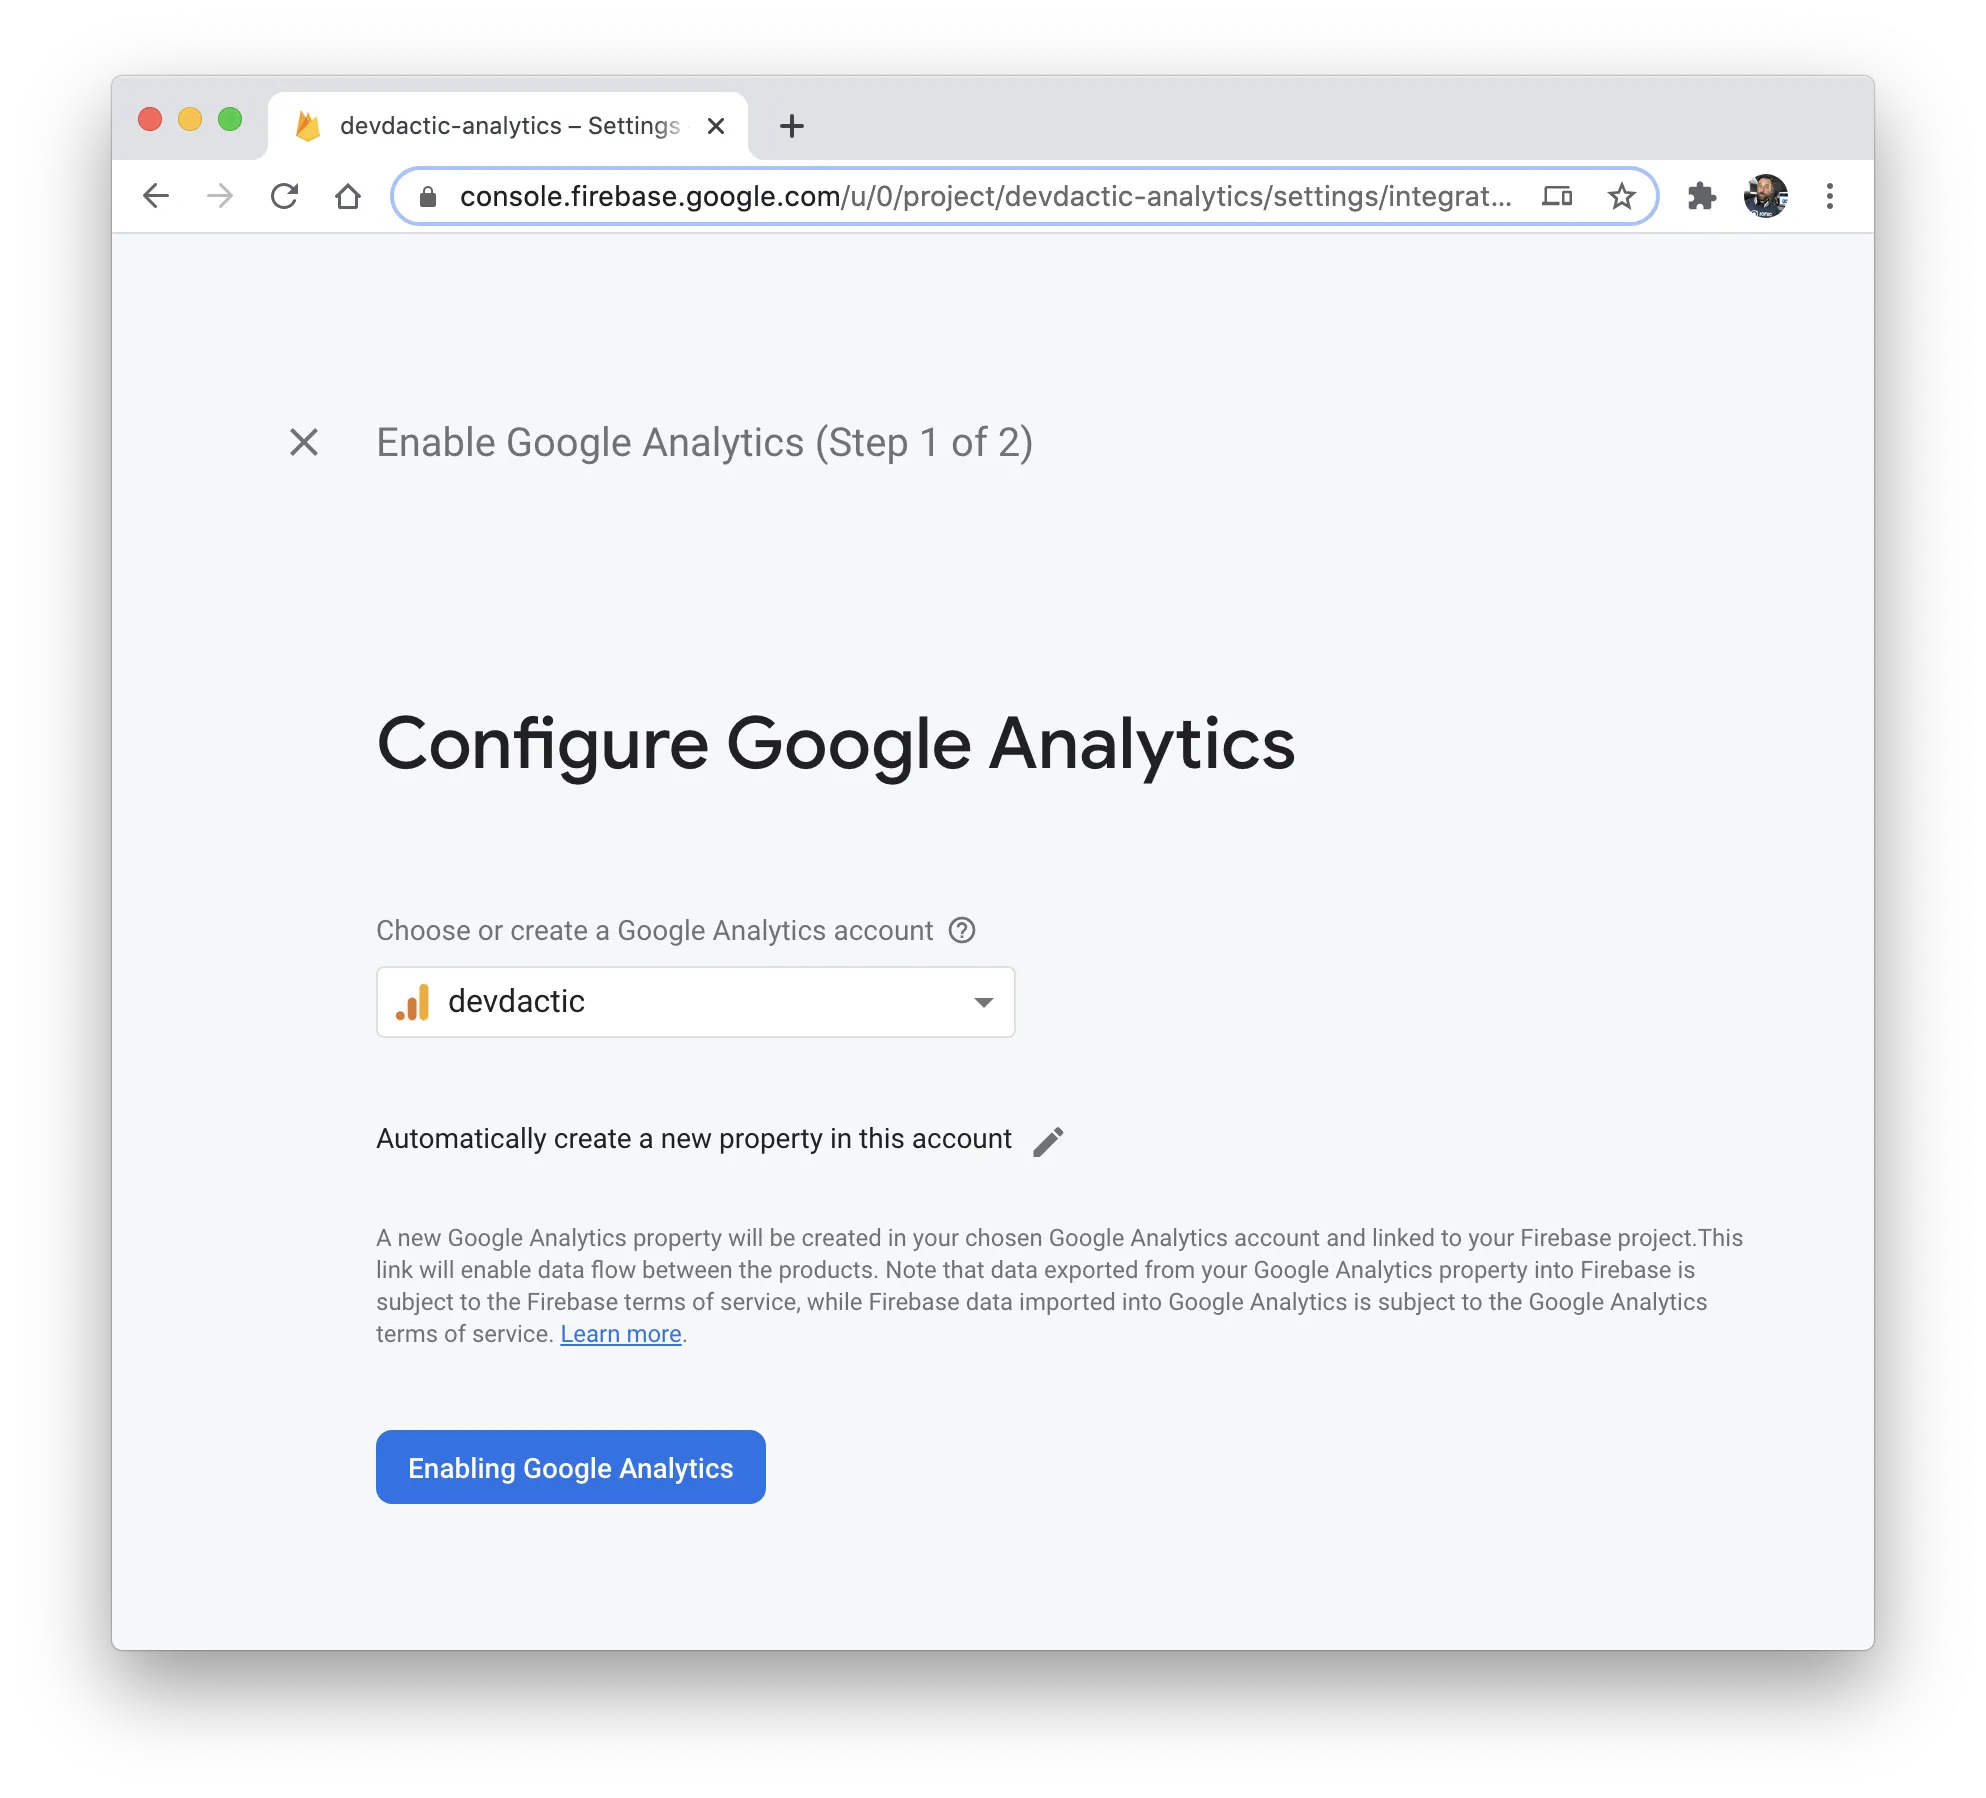
If you already got a project, you can also manually enable GA by going to Project settings -> Integration - > Google Analytics within your existing Firebase project!
The next step is to add a web, iOS and Android application inside Firebase. You can do this right from the Dashboard or by going to your Project settings -> General tab under “Your apps”.
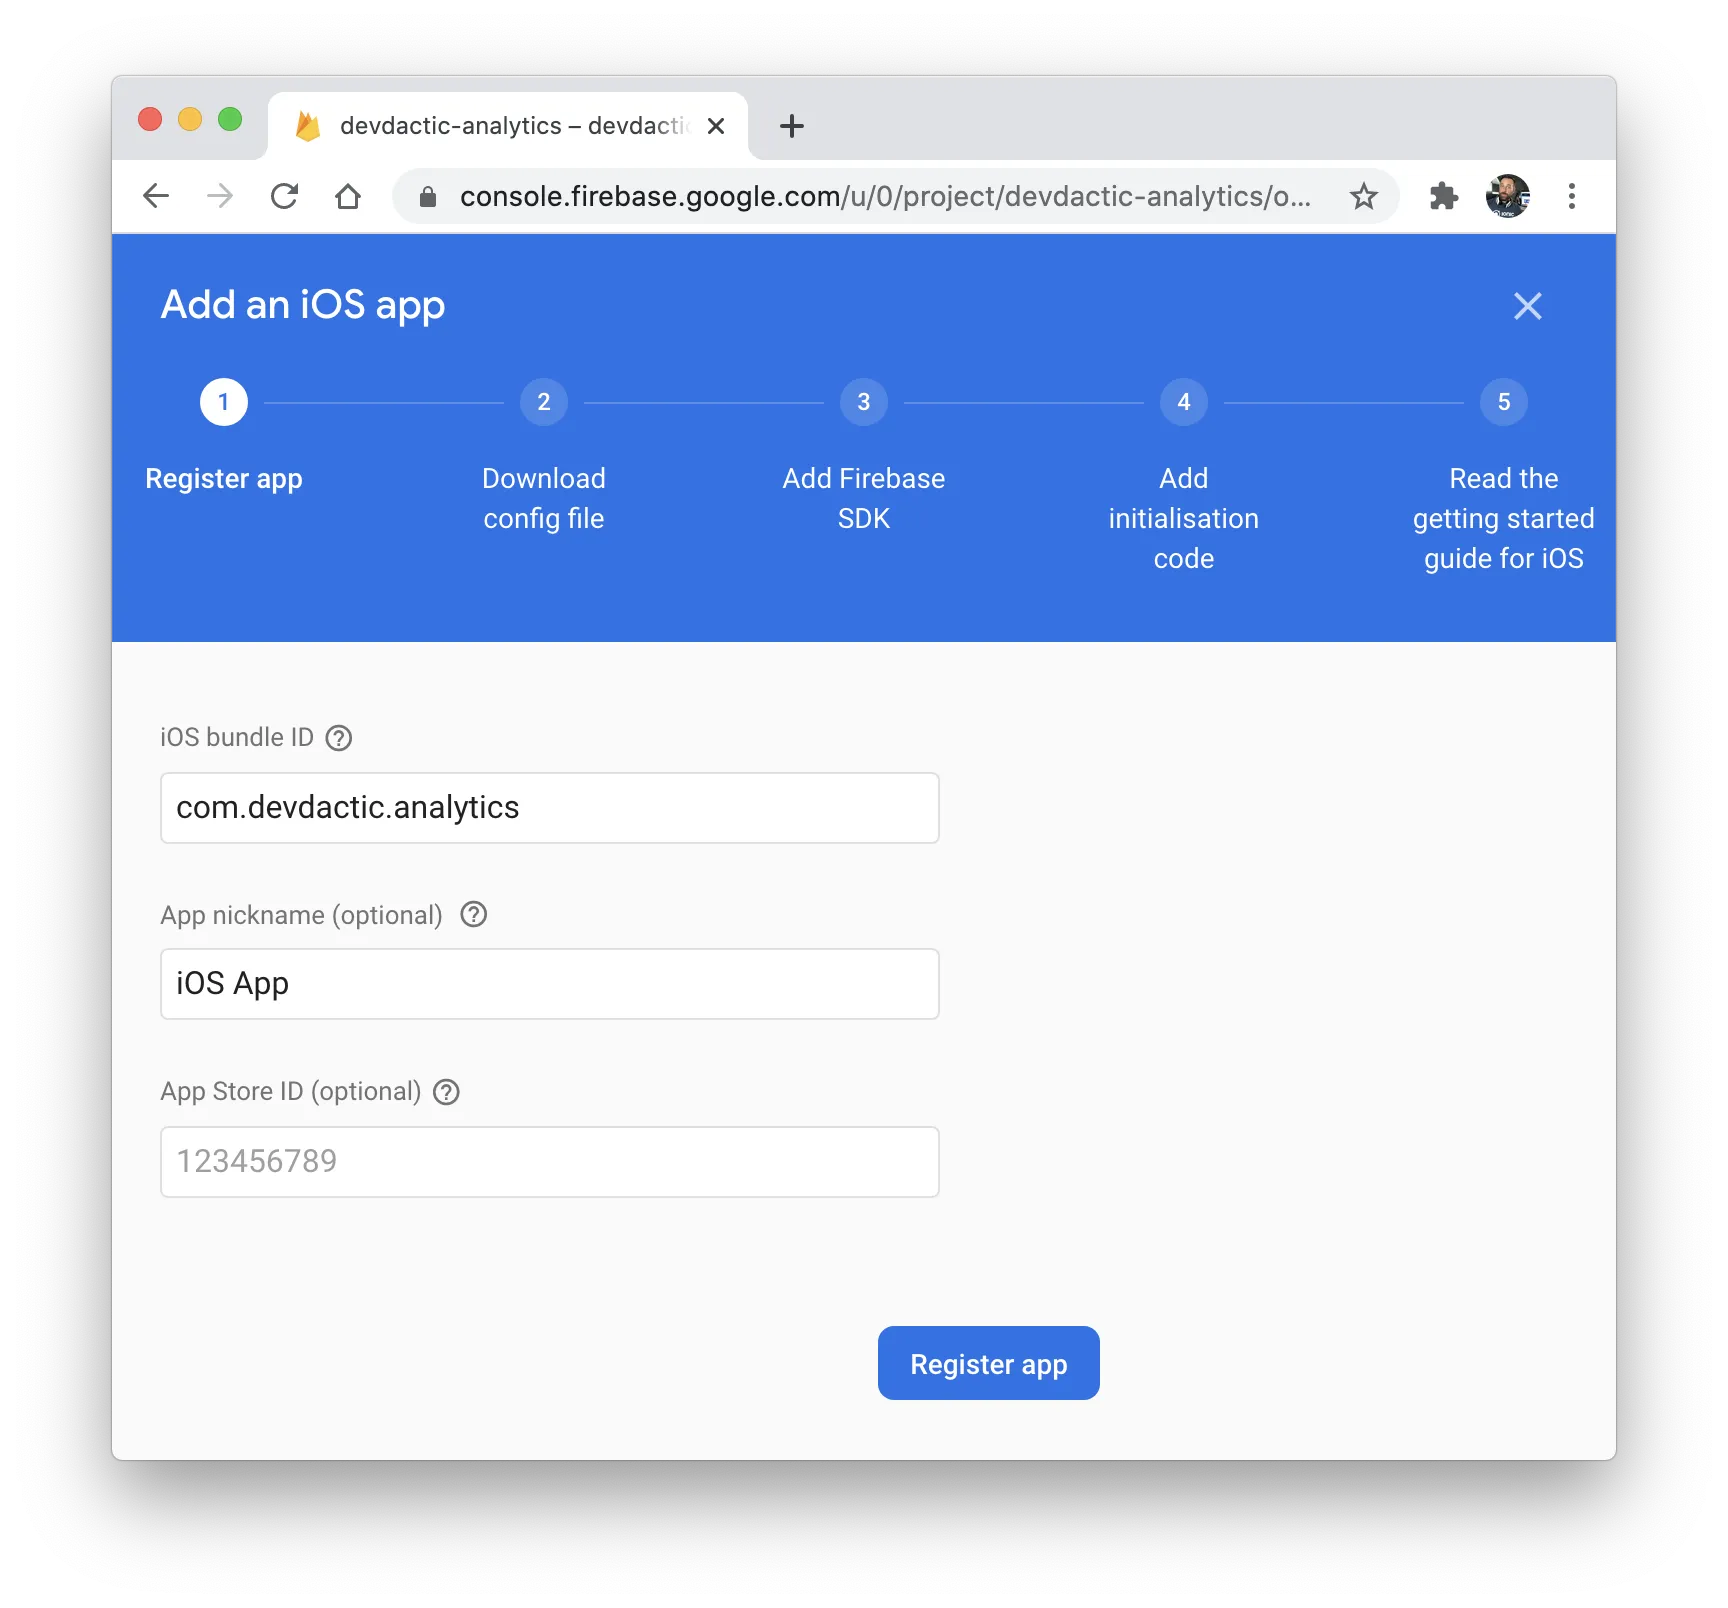
You only need to have the package id of your application (or the one you want to use), but all other information for ios/Android is optional. Same for web, here basically everything is optional and you only need the final Firebase configuration object you see at the end of the steps.
After the initial step for iOS and Android you can download a file, which you can for now simply put anywhere. The files are:
- google-services.json file for Android
- GoogleService-info.plist file for iOS
We’ll make use of these two files in a second so keep them at hand!
Ionic App Setup
Let’s start our app with the correct package id, which makes your life a lot easier. You can also skip all of this if you already have an existing app of course.
Within our new app we generated another service and page for some analytics logic, and install the Capacitor plugin:
ionic start devdacticAnalytics blank --type=angular --capacitor --package-id=com.devdactic.analytics
cd ./devdacticAnalytics

ionic g service services/analytics
ionic g page pages/second

npm install @capacitor-community/firebase-analytics

ionic build
npx cap add ios
npx cap add android
Once the basic setup is ready you can run the first build, which helps to quickly finish the setup for the native platforms as well.
But before, copy your Firebase web configuration into the environment/environment.ts like this:
export const environment = {
  production: false,
  firebaseConfig: {
    apiKey: "",
    authDomain: "",
    databaseURL: "",
    projectId: "",
    storageBucket: "",
    messagingSenderId: "",
    appId: "",
    measurementId: ""
  }
};
That’s the best place to store your web config.
iOS Integration
For iOS, simply open the native project like this:
npx cap open iosNow all we need to do is copy our GoogleService-Info.plist that we downloaded in the beginning from Firebase into our iOS project, and you should drag the file into the Xcode project right inside the app/app folder like in the image below.
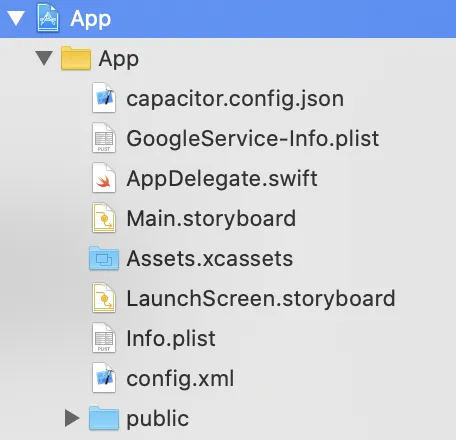
Don’t just copy it inside VSC, really use Xcode for this step!
Android Integration
There are only two things to do for Android, and that’s first of all moving the google-services.json that you downloaded to the android/app/ folder like in the image below.
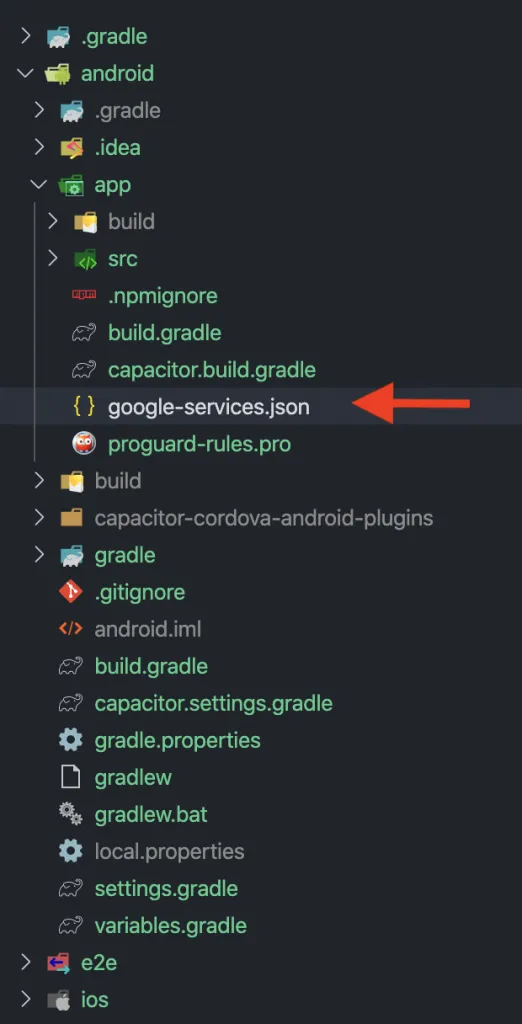
Once that file is in place, we need to register our Capacitor plugin inside the android/app/src/main/java/com/devdactic/analytics/MainActivity.java (attention: in your case it will be your package id in the path!):
package com.devdactic.analytics;
import com.getcapacitor.community.firebaseanalytics.FirebaseAnalytics;

import android.os.Bundle;

import com.getcapacitor.BridgeActivity;
import com.getcapacitor.Plugin;

import java.util.ArrayList;

public class MainActivity extends BridgeActivity {
  @Override
  public void onCreate(Bundle savedInstanceState) {
    super.onCreate(savedInstanceState);

    // Initializes the Bridge
    this.init(savedInstanceState, new ArrayList<Class<? extends Plugin>>() {{
      // Additional plugins you've installed go here
      add(FirebaseAnalytics.class);
    }});
  }
}
This step is basically necessary for all Capacitor community plugins with Android support. Simply import the plugin and call add() inside the init().
Implementing Firebase Analytics
Now we can get into the actual usage of our plugin, and I recommend you put all the analytics logic into a dedicated service that you can use from everywhere inside your app.
There are a few key functionalities that we can use:
- initializeFirebase: Only necessary for the web, so leave it out if you only target native platforms
- setUserId : Identify logs by a specific user. I recommend to use the FB auth unique ID or any other unique user ID for this!
- setUserProperty: Add a property to the user logs. You can have up to 25 unique properties, so don’t store every trash in them.
- logEvent: The most basic of all events - just log that something happened. Check out the recommendations for events!
- setScreenName: Only works on ios/Android! Track the view of a specific page/screen of your app. I added a little logic to connect this with the router events so you don’t need to manually call this in each of your pages, but the information from the router is limited to the URL itself.
- setCollectionEnabled: Enabled or disabled the collection of user events and data. Helpful if you want to not track anything unless the user has opted in for tracking or other legal documents.
Much of this contains dummy data, so you could extend the service functions with some parameters in order to use them from everywhere in your app. For now simply open the services/analytics.service.ts and change it to:
import { Injectable } from '@angular/core';
import { environment } from './../../environments/environment';
import { Router, RouterEvent, NavigationEnd } from '@angular/router';
import { filter } from 'rxjs/operators';

// Init for the web
import "@capacitor-community/firebase-analytics";

import { Plugins } from "@capacitor/core";
const { FirebaseAnalytics, Device } = Plugins;

@Injectable({
  providedIn: 'root'
})
export class AnalyticsService {
  analyticsEnabled = true;

  constructor( private router: Router) {
    this.initFb();
    this.router.events.pipe(
      filter((e: RouterEvent) => e instanceof NavigationEnd),
    ).subscribe((e: RouterEvent) => {
      console.log('route changed: ', e.url);
      this.setScreenName(e.url)
    });
  }

  async initFb() {
    if ((await Device.getInfo()).platform == 'web') {
      FirebaseAnalytics.initializeFirebase(environment.firebaseConfig);
    }
  }

  setUser() {
    // Use Firebase Auth uid
    FirebaseAnalytics.setUserId({
      userId: "test_123",
    });
  }

  setProperty() {
    FirebaseAnalytics.setUserProperty({
      name: "framework",
      value: "angular",
    });
  }

  logEvent() {
    FirebaseAnalytics.logEvent({
      name: "login",
      params: {
        method: "email"
      }
    });
  }

  setScreenName(screenName) {
    FirebaseAnalytics.setScreenName({
      screenName
    });
  }

  toggleAnalytics() {
    this.analyticsEnabled = !this.analyticsEnabled;
    FirebaseAnalytics.setCollectionEnabled({
      enabled: this.analyticsEnabled,
    });
  }

}
The rest of the implementation is pretty boring since we just need a way to call our functions, so let’s quickly change the home/home.page.ts to:
import { Component } from '@angular/core';
import { AnalyticsService } from '../services/analytics.service';

@Component({
  selector: 'app-home',
  templateUrl: 'home.page.html',
  styleUrls: ['home.page.scss'],
})
export class HomePage {
  enabled = this.analyticsService.analyticsEnabled;

  constructor(private analyticsService: AnalyticsService) { }

  setUser() {
   this.analyticsService.setUser();
  }

  setProperty() {
    this.analyticsService.setProperty();
  }

  logEvent() {
    this.analyticsService.logEvent();
  }


  toggleDataCollection() {
    this.analyticsService.toggleAnalytics();
    this.enabled = this.analyticsService.analyticsEnabled;
  }

}
And finally the view with the buttons to call our actions inside the home/home.page.html:
<ion-header>
  <ion-toolbar color="primary">
    <ion-title>
      Devdactic Analytics
    </ion-title>
  </ion-toolbar>
</ion-header>

<ion-content class="ion-padding">

  <ion-button expand="full" (click)="setUser()">Set User ID</ion-button>
  <ion-button expand="full" (click)="setProperty()">Set User Property</ion-button>
  <ion-button expand="full" (click)="logEvent()">Log Event</ion-button>
  <ion-button expand="full" routerLink="/second">Go to second page</ion-button>
  <ion-button expand="full" (click)="toggleDataCollection()">Toggle Data collection</ion-button>

  Analytics enabled: {{ enabled }}

</ion-content>
Additionally I have added a back button on the second page we created - I’m quite sure you know how to do that yourself, don’t you?
Testing Your App
The testing is what took me the most time, since it’s a bit tricky. If you use the web/native app in the standard way, it will take quite some time until you see any logs inside Firebase.
The reason is that usually the logs are sent as a batch every few hours to save battery life (actually kudos for this).
But there is actually a DebugView inside the Firebase menu which you can select to see debug logs. The logs you see in here don’t count towards the other “real” statistics you see inside the Firebase console!
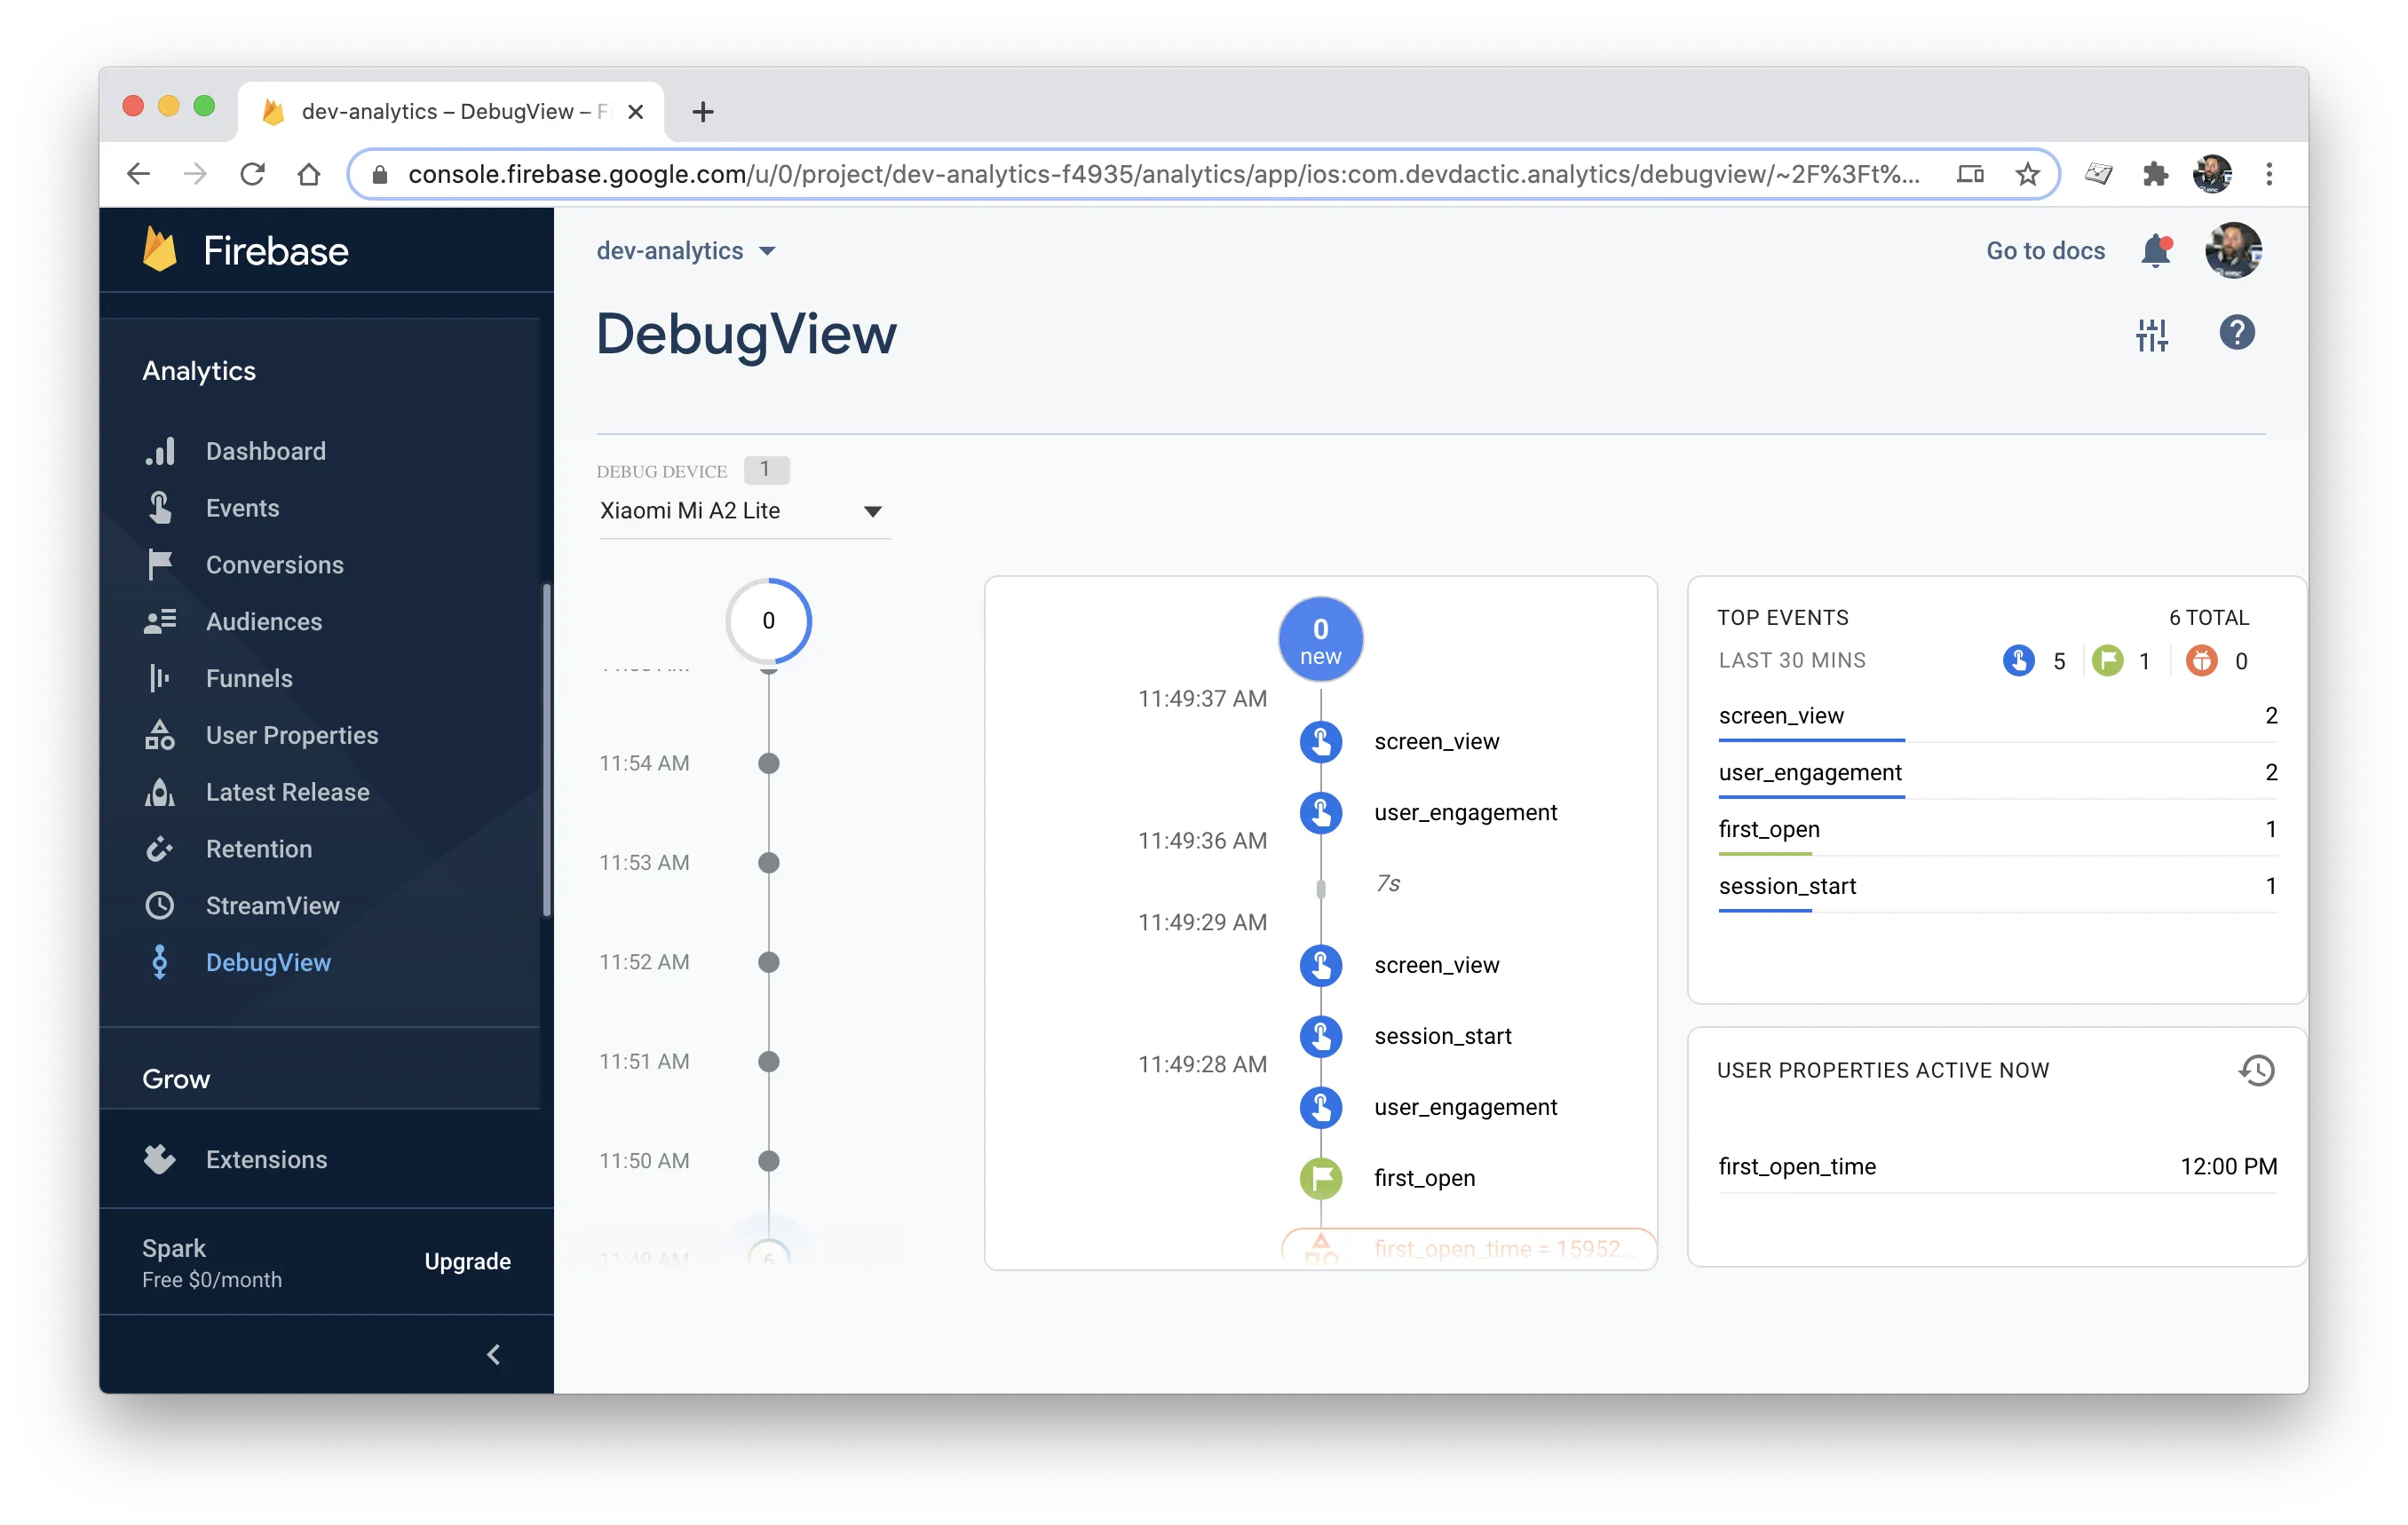
To see your logs appear in here, you need to follow a different approach on each platform.
You can also find all the debug information in the official docs.
Web
For the web, you don’t get any response of the plugin per default so you need to apply a trick: Go to the Chrome store and install the Google Analytics Debugger extension.
After doing so, you get a little icon next to your address bar and after enabling it, you should see a lot of logs for each action you take with the plugin!
iOS
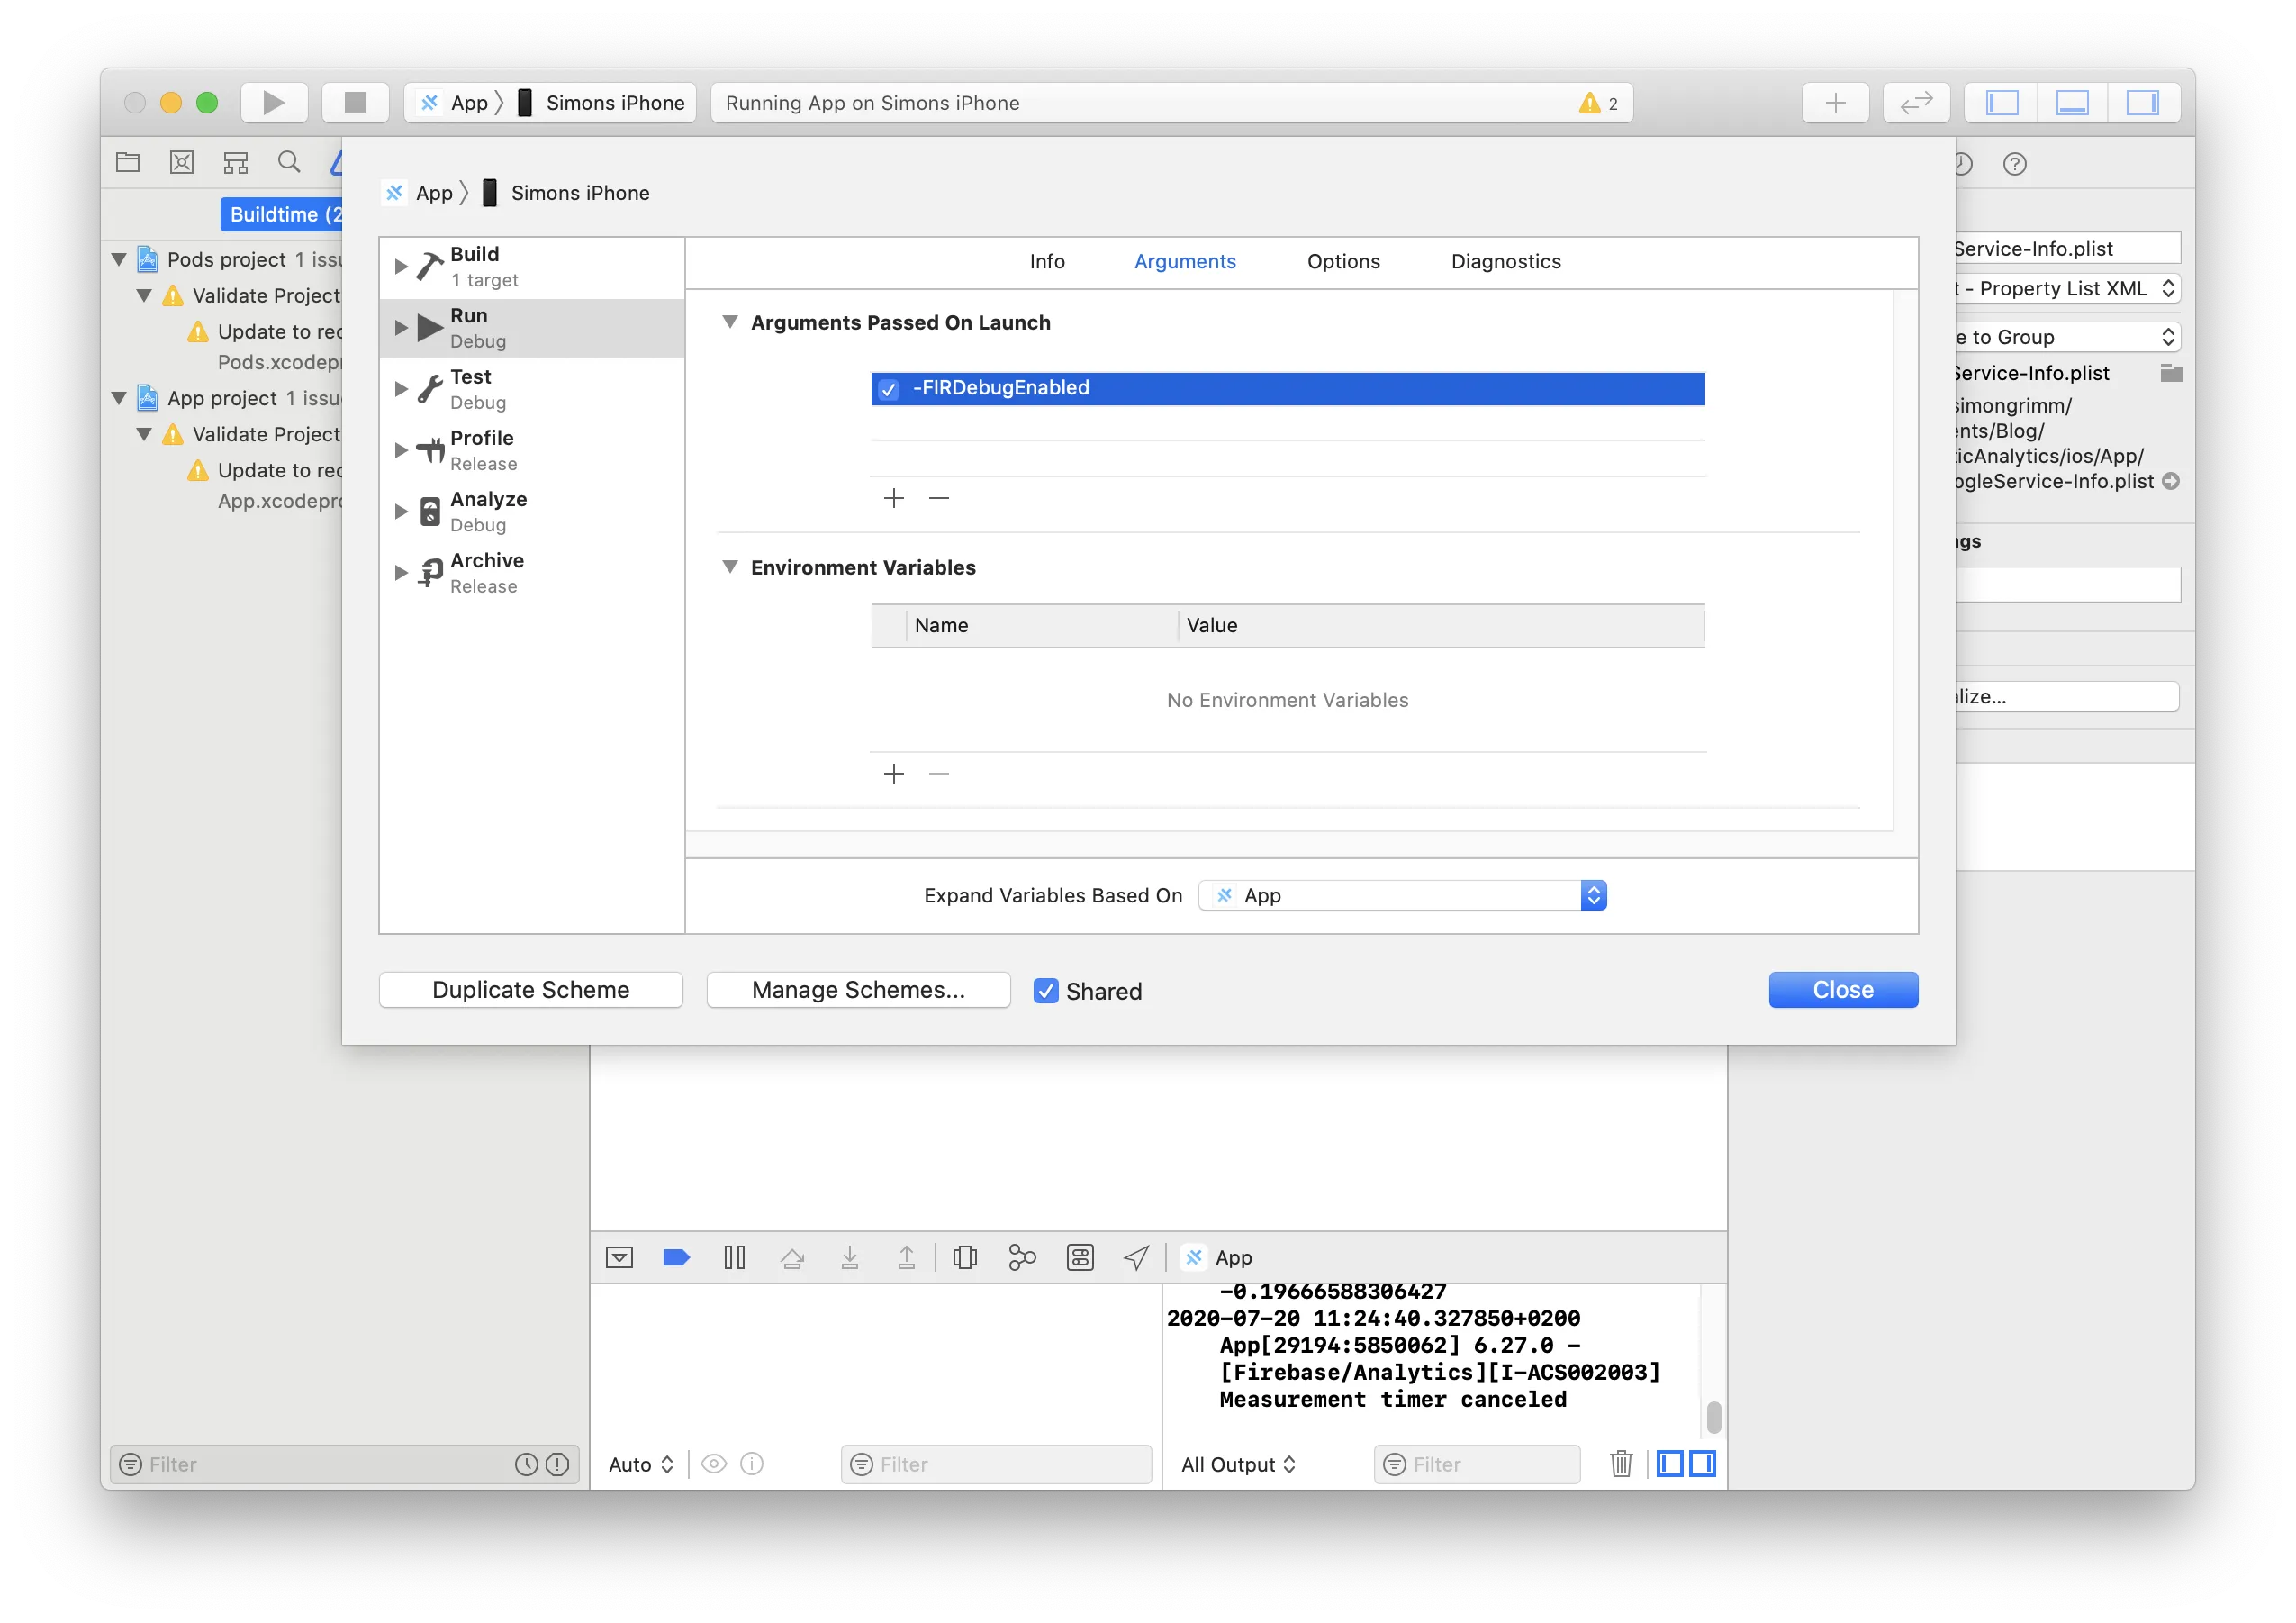
To start your iOS app in debug mode, all we need to do is add a flag to the launch arguments of your app. You can do this within Xcode by going to Product -> Scheme -> Edit Scheme in the top bar, and then add this flag to the launch arguments within the Run section:
-FIRDebugEnabledAfter setting the flag it should look like in the image below.
Once you don’t want a debug app anymore, you explicitly need to set the opposite of the flag, which is this:
-FIRDebugDisabledAndroid
All we need to to for Android to enable the debug mode is calling this from your command line while your device is connected:
adb shell setprop debug.firebase.analytics.app <package_name>

# To later disable it
adb shell setprop debug.firebase.analytics.app .none.
Make sure you are using the package name of your app, so for me it was “com.devdactic.analytics”.
A quick addition: When creating a native Android build I encountered an error and the answer in this issue was my fix. I simply set the value inside android/variables.gradle to this:
firebaseMessagingVersion = '20.1.6'This might not be relevant in the future, but wanted to keep it in here in case you encounter that problem!
Conclusion
Firebase analytics is easy to set up ad one of the best ways to track engagement and events within your Ionic app if you already use Firebase anyway.
If you would like to see a future post on other remote logging services let me know below in the comments!
You can also find a video version of this tutorial below.